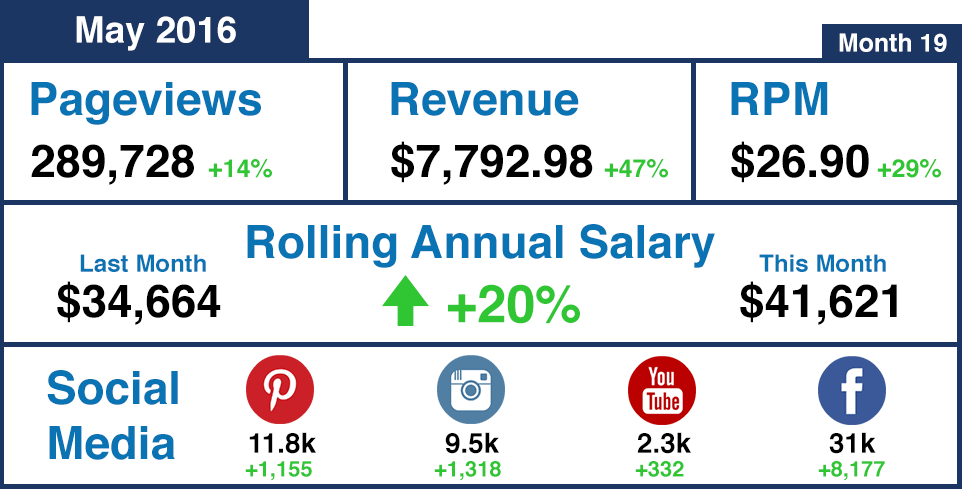
 Trevor here, making my monthly guest appearance to present our May 2016 Income Report.
If you’re just joining us, normally you’ll find me over at The Blog Village helping other bloggers create, grow and monetize their blogs. We are launching publicly in just three short weeks and have some really incredible things coming!
Okay, on with the income report!

If you haven’t read one of our income reports before, you may be scratching your head. This is where we open up and show people how the business side of blogging looks and that it’s possible to make an income doing something you love and working on your own terms. As always, the food will return shortly. If the idea of sharing income and learning how to make a living online isn’t interesting to you, I suggest checking out these Greek Kababs and heading to the grill, a new recipe will be coming Monday!
Here’s a brief introduction to these traffic and income reports…
If you’ve stopped by our about us page, you know that Jennifer and I started this blog a year and a half ago with the hopes of it earning an income for Jennifer. I’ve since quit my job and we’re taking a calculated risk that we can make this blog both of our full-time jobs.
Without income reports like this, we never would have known it was even possible to take that leap. Our hope is that, for those interested, these reports can help to show what worked for us, the mistakes we made and that it is possible to make an income online doing something that you love if you work hard and stick with it.
None of these reports on their own tell the story of how to create, grow and monetize a blog. Think of each one as a chapter in a book that continues to be written. To get the full picture, I suggest looking at our traffic and income reports page where you can click into individual reports, like this one, to see the slow steady growth from our first month a year and a half ago where we made $28.
Okay, enough with the backstory, let’s get on to the report…


Income: $7,792.98
Sponsored Content: $4,675
Google AdSense: $60.06
Amazon Associates: $59.14
Swoop: $61.27
YouTube: $27.73
Expense: $333.05
Audio Jungle: $100.00 <– music for our videos
ActiveCampaign: $70.00
Adobe Creative Cloud: $54.79
OptinMonster: $16.60
Tailwind: $11.00
Capture One: $10.00
Buffer: $10.00
Google Apps: $8.33
VaultPress: $5.00
Net Profit: $7,419.93


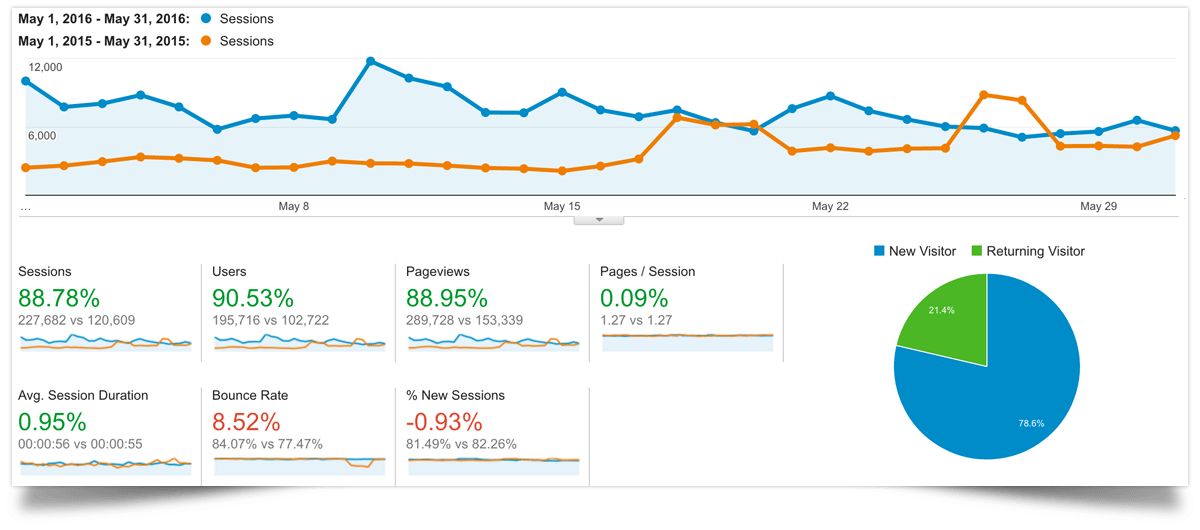
This month, I’ve decided to start showing the comparison from the previous year when we’re looking at traffic to give more context to what you’re looking at.
Depending on what type of blog you have, different times of the year have more or less traffic. Because of this, it can be deceptive (and maddening) when you’re comparing back-to-back months which may be comparing a high period and low period. You can get a much clearer and more realistic growth story by comparing the same time the previous year.
For us, as long as we’re seeing consistent year-over-year growth, we aren’t as concerned about the ebbs and flows of the individual seasons or months. When we compare where we’re at this year vs last year, we’re up about 90% across the board which we can feel great about even if in the short term it feels like traffic is slow and down for the summer.

If you haven’t gotten the idea from all of the charts and graphs, I really like analytics. Analytics aren’t just a fun hobby though, they are a very important business tool.
Analytics can help to evaluate performance, motivate by showing growth, encourage change when you see attrition, inform your various editorial and social sharing schedules and much, much more.
Analytics let you make data-driven decisions instead of relying on emotional, personal or gut based decisions. Before your eyes glaze over completely, let me give you an example.
In last month’s income report, we talked about focus and where to prioritize your time. We use analytics to further help us define where we prioritize that time when it comes to things like social media channels.
Based on where we are seeing the largest growth, engagement and traffic we will focus there and if we run out of time, we can make an informed decision on what to drop off our to-do list.
We also use analytics to make editorial decisions, what types of videos to make, what days and how many times we post to social media, etc.
Now the important thing is that analytics are not universal and that’s why it’s important for you to know what works for you and that means experimenting and tracking results.
You may be thinking, not needed, I have a good feel of how what I’m doing is performing. That may be true when it comes to big obvious changes, but what about if something is performing just 5% better?
If we both started with 5,000 followers and you grew that by 10% each month but I only grew at 5% (which probably “feels” about the same day to day). Two years down the road, you would have almost 60,000 followers while I’d have 18,000.
Pretty staggering how someone just doing things a little better can perform over time.
So, we get it, it’s worth it to keep track of what’s going on, how do you do that?
The good news is that a lot of social media platforms and google analytics provide you with ways to look at the analytics on each of their platforms and your site. Get familiar with them and what the most important metrics are for you. For platforms that don’t provide analytics, you can keep track of stats using a spreadsheet (we did this for a long time).
Regardless of how you monitor your analytics, don’t ignore them and be sure to realize the power the information they provide have in growing your blog!
As always, if you have questions leave a comment below, I read and answer each and every one!


Denise
Trevor @ Show Me the Yummy
London
Trevor @ Show Me the Yummy
Marina
Trevor @ Show Me the Yummy