Trevor here with a break from our regularly scheduled programming to bring you our year one traffic and income report. We want to share how we reached 1.5 million pageviews and $10K in revenue our first year… don’t worry, the food will be back Monday 😉 .
Why are you sharing?
For us, this is about giving back and educating. We want anyone interested to see that it’s possible to earn an income online. We also want to share what works and what mistakes we’ve made along the way. Most importantly, without income reports, this blog wouldn’t exist.
Let me explain…
The dream
Jennifer has always dreamed about having a blog be her full-time job. The problem was it was always difficult to justify whether it was even realistic to make money blogging.
We purchased showmetheyummy.com in January of 2013 but didn’t start the blog until the end of October 2014 because of this uncertainty. It was bloggers sharing income reports that demonstrated to us that it really was possible to earn an income from a blog.
This gave Jennifer and I the confidence to start making her dream come true.
Here we go!
We’ll be thrilled beyond belief if these reports motivate you to explore making extra cash to pay for a vacation, a second income or even your full-time job online, because that’s what they did for us. Paying it forward and all 🙂
Okay.
I know what you’re thinking, Show Me the Yummy… Show Me the Money!… and traffic.
For those who need instant gratification, the summary of what you’ll read below is this:
Gross revenue

Traffic
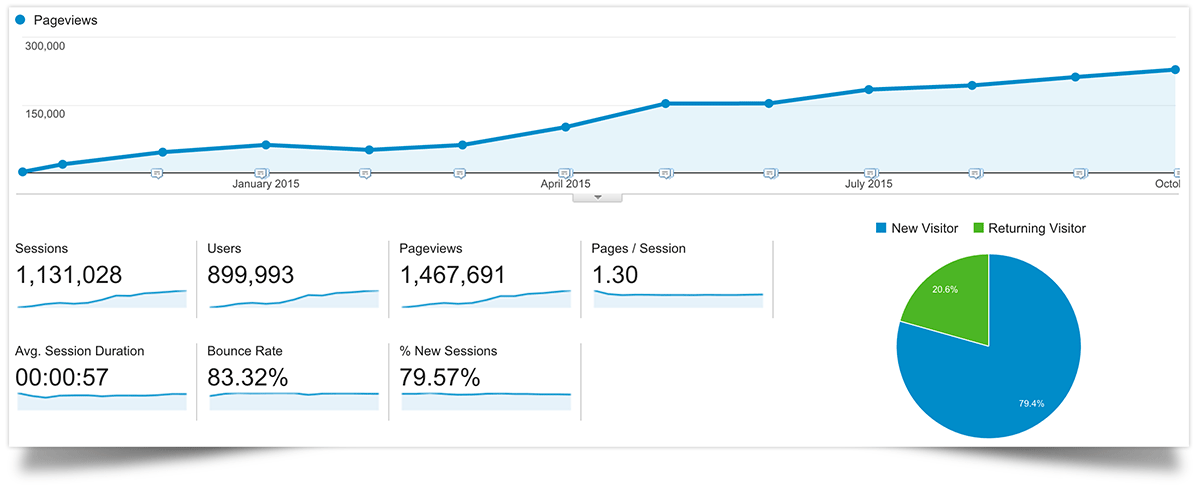
Instant gratification satisfied 🙂
Bring on the detail!
This is an epic traffic and income report blog post. I promise our normal income reports won’t normally be this crazy long, but I want to show this in detail month by month so that you can see exactly how the growth occurred for us.
There aren’t a lot of places you can find these reports from day 1, so our hope is that this will be really insightful and helpful to those considering starting a blog or just starting out.
I’ve tried to include small tips that we learned each month. There is a lot more detail which we’ll go into in future reports, but I wanted to give some insight into what we found very important.
Things to note:
1. We haven’t included food expenses below because a large part of what we spend on groceries for the blog replaces what we would have spent on groceries normally. Typically that expense for the two of us is about 3-4 hundred dollars per month. We wanted to show expenses we would not have had without the blog.
2. Initial setup costs that aren’t included (because we initially purchased them in 2013) were:
- The Genesis Framework: $60
- Foodie Pro Theme: $70
These are the core of what Show Me the Yummy is built on. The Genesis Framework is a very robust and solid foundation that you add a theme to, Foodie Pro in our case, to create the look/feel/functionality of your site.
You can get started with just the hosting and find a free theme and no framework, but it was something we chose early on to invest in… and to this day we’re still very glad we did. It made things go a lot faster and easier early on.
And we begin…

Traffic
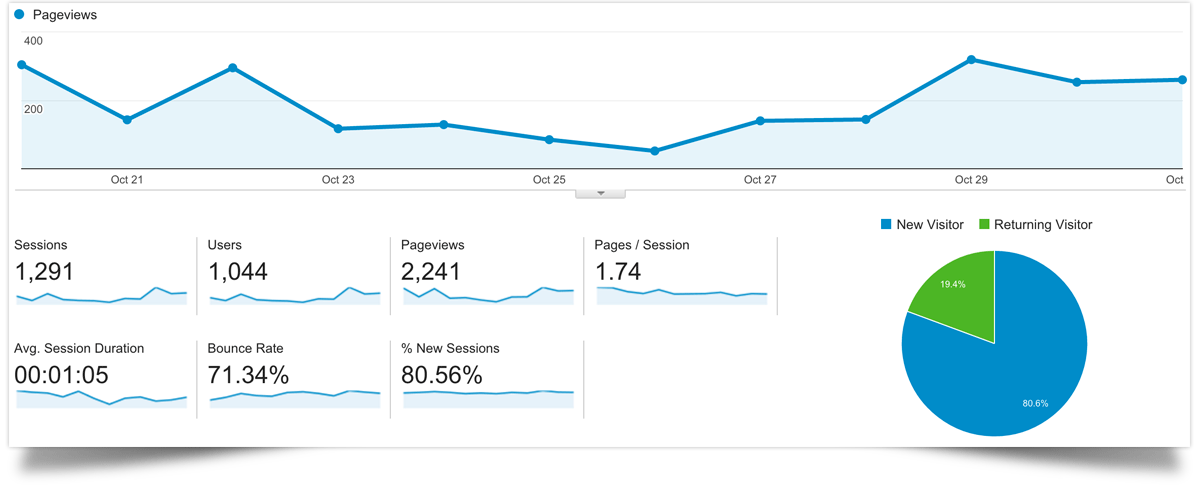
Soft launch
October was the soft launch. These two weeks were spent letting our friends know that the blog was starting and tweaking the look and feel of the blog.
Create great content
“Big things have small beginnings” was our mantra in October. Jennifer and I spent a lot of time on the photography side of things, getting her comfortable with artificial lighting (our apartment barely got any natural light) and editing photos. It was really important for us from the beginning to deliver the absolute best photography and content we could.
We also committed to being very intentional about trying to improve something, no matter how small, with each post that went live. It could be related to photography, food styling, writing, technical execution, anything as long as we could always look at each new post and see improvement from the last.
Focus on rpm
We began monetizing the blog with three small 300×250 AdSense ads in the sidebar that generated a whopping $6.56… which we were actually really excited about! We may have even purchased two pints of ice cream with that money to celebrate.
When just starting out, the dollars coming in from monetizing a blog aren’t going to be big. The important number to look at is the RPM or Revenue Per Mille. This is the revenue earned per 1,000 pageviews. Just starting out, $2.93 is definitely nothing to sneeze at. It actually took us five months to get back to this mark. When you look at RPM, you put the focus on optimizing your revenue as efficiently as possible… the traffic will come in time and act as a multiplier of that number.
Quick example: A site with 100,000 pageviews and a $1 RPM is actually making less than a site with 20,000 pageviews and a $10 RPM. This is why you can actually find many, many sites that don’t have large amounts of traffic that are still able to make a great income. They can focus on a niche audience that earns them more money.
100,000 pageviews -> 100 X $1 = $100
20,000 pageviews -> 20 X $10 = $200
October breakdown
Income: $6.56
Expense: $44.09
Adobe Creative Cloud: $10.94
EasyRecipe Plus (recipe box plugin): $24.95 *one-time purchase
Net Profit: -$37.53

Traffic
Get social
The blog goes public and we dove into the sprawling world of food sharing websites, social media, social media and did I mention social media… yes, it takes that long to blanket all social media 😉
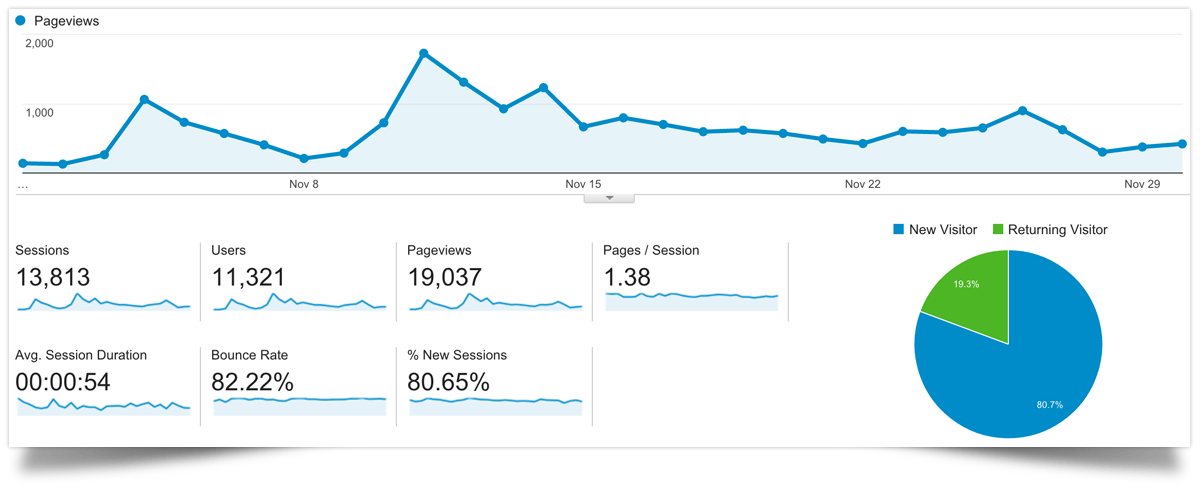
Jennifer started out posting three days a week in October for the soft launch and moved to five posts a week in November. That’s a lot, but the idea was to build a decent library of content so that when people came to the site, they’d be motivated to come back.
Realistically that library wasn’t too important. We find the large majority of people, 80%+ that come to a food blog get that one recipe they searched for or saw on pinterest/facebook and then leave. They aren’t taking the time to peruse our entire library of recipes. The most realistic upside to adding more content is getting more traffic from search & social because there are more recipes out there.
The traffic spikes this month were when Jennifer had some recipes featured on the front page of Food Gawker and a reddit post which drove 1,727 page views in one day on Nov. 11th.
The first couple of weeks we were averaging 200 page views a day, so 1,727 felt like we had arrived 😉
Don’t put all of your eggs in one basket
We expanded our monetization with two other advertising providers this month, Sovrn and Swoop. Sovrn is a traditional display advertiser and Swoop places small ads in the recipes we show at the end of each post. In January, we also began to use affiliate sales to help diversify through the Amazon Affiliate program.
Affiliate sales are just a way for a company, Amazon in this case, to pay a third-party, that’s us, if we direct traffic to them and someone makes a purchase. It’s a win-win because we recommend products we use and trust, and if our reader buys it on Amazon it’s the same price (or let’s be honest, lower because it’s Amazon) but we get a small percentage which helps us to keep the blog up and running.
By diversifying your monetization you’re setting yourself up to be less exposed if one network starts performing poorly. There are more ways to diversify, but we’re only one month in… we’ll get to those 🙂
November breakdown
Income: $28.14
Expense: $29.14
Net Profit: -$1.00

Traffic
Buzzfeed
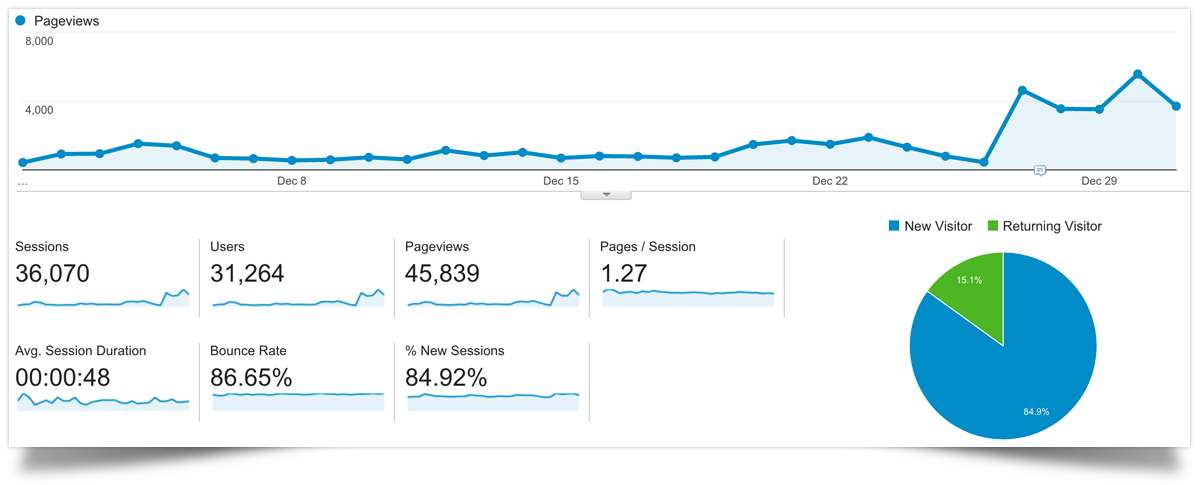
Well, Merry Christmas to us! December started off doing well, we were really happy with the solid performance. But then out of nowhere, right after Christmas the BuzzFeed elves delivered a gift. Only two months into the blog, Jennifer had two of her recipes featured as the best of 2014 by BuzzFeed.
As you can see above, this drove WAY more traffic than we had seen prior to that. We watched all day as 30-40-50 people were on the site at one time via realtime google analytics (there were one or two people on at any given time if any up to this point). Not only that, but it got even busier as the article was shared around the web making the end of 2014 a pretty awesome exclamation point to the year for our little blog with nearly 46 thousand page views in only our second full month!
Preparation meet opportunity
That BuzzFeed feature was made possible by two things.
1. Preparation: Jennifer worked hard creating great content and posting recipes to every possible site and social media channel she could find.
2. Opportunity: BuzzFeed was looking for great recipes to feature in an end of year round-up.
Notice I didn’t say, “we got lucky because BuzzFeed featured us”. I firmly believe that luck is what happens when preparation meets opportunity and if the work required for #1 was never done, well… we wouldn’t have been so “Lucky”.
Keep in mind, content aggregators, or sites that primarily share other’s content (like BuzzFeed), are always looking around for new things to post about, so it’s paramount that you keep getting content out there to be seen and discovered.
December breakdown
Income: $81.01
Expense: $29.14
Net Profit: $51.87

Traffic
Residual effects
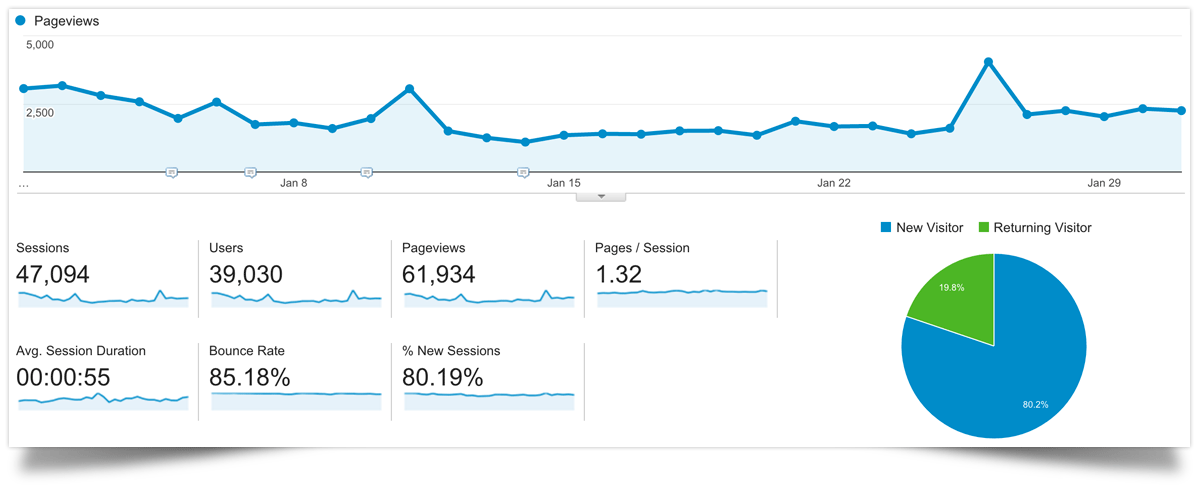
As you can see the “BuzzFeed Effect” continued through January 14th, where traffic levels back out. Because of the December spike, our MoM (Month over month) growth was only 2%, but the fact that we were able to still increase traffic from December without a big feature was a great win.
January 26th was an interesting blip where nothing happened except for a sudden increase in google rankings for the day (you can see how important google can be).
Give me a lift?

This chart shows the comparison from December to January where you can see the lift from the BuzzFeed article. If you look at the week of Dec. 15th, you’ll see that the week of Jan. 19th is approx. double the traffic. These lifts occur for three reasons:
- A whole lot more people found the site, some of which come back.
- Traffic continues to come from the BuzzFeed article via direct traffic and also their article showing up in search results (this continues a year later)
- Most importantly, because we got that link from BuzzFeed, Google says… “Okay, this really established site (BuzzFeed) just linked to showmetheyummy.com, they must have valuable content, I’ll rank them a bit higher now”. That’s an oversimplification but it’s essentially what’s happening. These are known as “Backlinks” (another site “linking back” to your site) and most SEO experts agree they are the most important element for improving your Google search rankings (when not abused… google knows all).
January breakdown
Income: $82.95
Expense: $58.14
Adobe Creative Cloud: $10.94
Capture One: $10.00
Viraltag: $29.00 (this was replaced with tailwind in April)
Net Profit: $24.81

Traffic
Back to reality
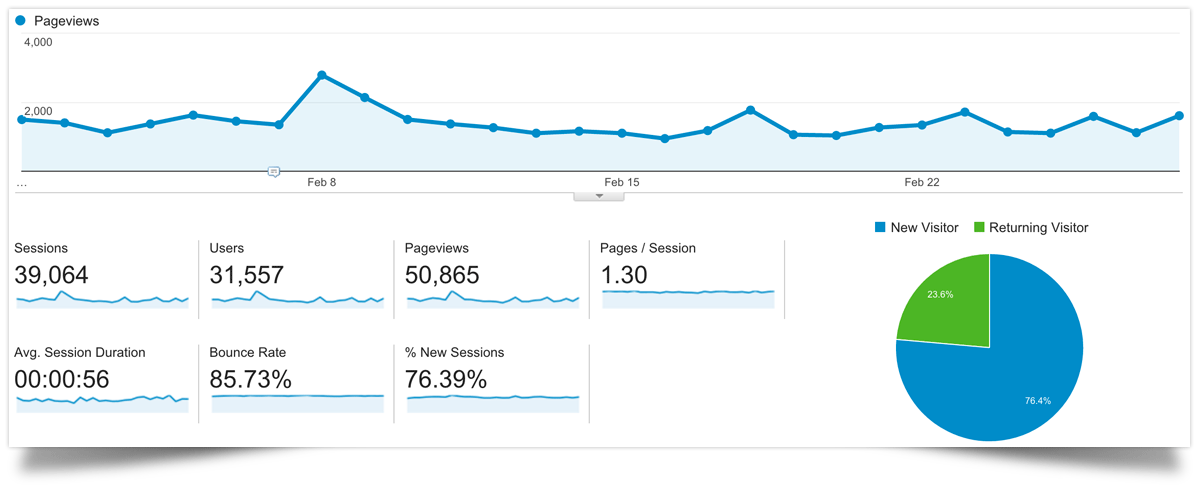
The reality was that December and January were uncharacteristically high traffic months for us up to this point and we didn’t have the expectation that our growth would continue on that trajectory.
It didn’t 🙂
What did continue to rise however was the money we made. That’s right, with an 18% percent drop in traffic we actually made 34% more income.
Why?
Since you’ve been following along, you got it… RPM. Our RPM was back on the rise at $2.18. This was due to us playing around with our ad placements to increase our revenue and making sure we used Amazon Affiliate links when we were talking about products we use in the kitchen.
We also hit a big milestone which was making over $100 in one month (and almost $200)… yes the dinner celebration essentially wiped that out… we got excited 😉
February breakdown
Income: $110.96
Expense: $219.47
Bluehost Hosting: $8.20
Adobe Creative Cloud: $10.94
Capture One: $10.00
Viraltag: $29.00 (this was replaced with tailwind in April)
Net Profit: $-108.51

Traffic
Back on the upswing
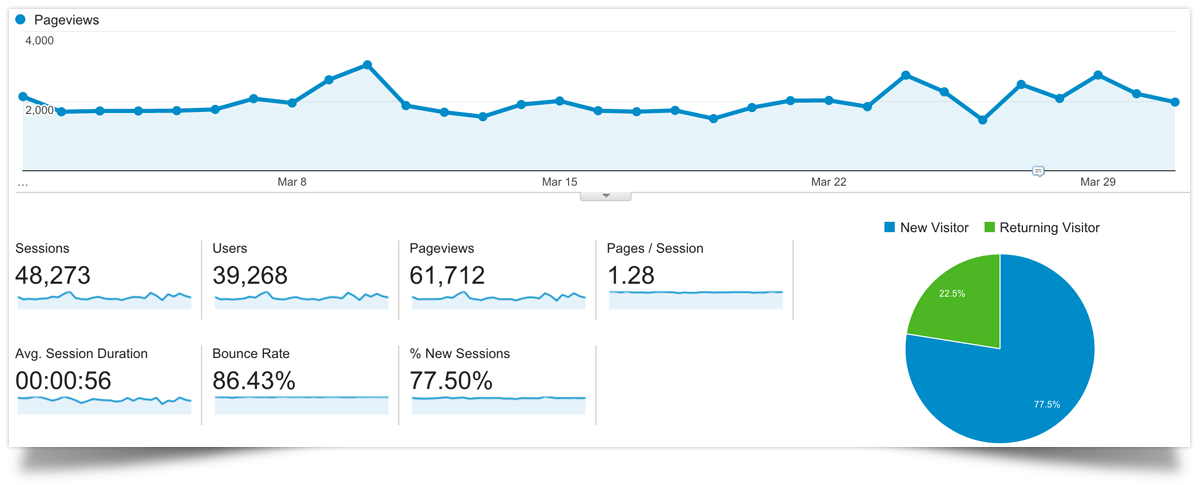
March was a pretty exciting month for us even though nothing particularly earth-shattering occurred. Traffic was back at the level it was in January, but this time without any huge feature or massive spikes in traffic.
Jennifer also felt like she was finally hitting her stride and feeling confident with everything she was doing from recipe development, to planning, social media and more. So proud of her!
Balance
The most notable change in March, which may surprise you since we were seeing growth, is that Jennifer returned to posting three times a week. This was largely because we were now five months in and we decided that we had a nice library of around 100 recipes and we wanted to add focus on growth instead of just content creation.
The other factor was that we wanted to enjoy this ride and still spend time together… not working on the blog. It was a difficult decision because we didn’t want things to slow down, but for us an important one. We knew from the beginning that this would be a journey not a race and the most important thing you can do is keep reminding yourself to ENJOY THE EXPERIENCE.
Ever since making that decision, we’ve had positive growth every month.
March breakdown
Income: $184.17
Expense: $63.14
Adobe Creative Cloud: $10.94
Capture One: $10.00
Viraltag: $29.00 (this was replaced with tailwind in April)
VaultPress: $5.00
Net Profit: $121.03

Traffic
Blogging is a journey, not a race
Okay, if you’re keeping track we’re now six months in. Over a thousand of hours of work, way too many leftovers 😉 and we’re bringing in $347. That by no means is nothing, but when you do the math to figure out an hourly wage… let’s just say we’re not anywhere close to making minimum wage at this point. BUT, the important thing to remember is that time + hard work = success.
You can’t measure something like a blog by a single month’s performance, you need to look at the growth. You’re investing a lot of hard work up front to pay off later. The biggest competitive advantage you have is working harder than others are willing to and staying consistent over a long period of time. If you can do that, you’ll be rewarded. Pep talk over… I’m not sure if that was for you or us 😉
Hi google, we’re show me the yummy, nice to meet you!
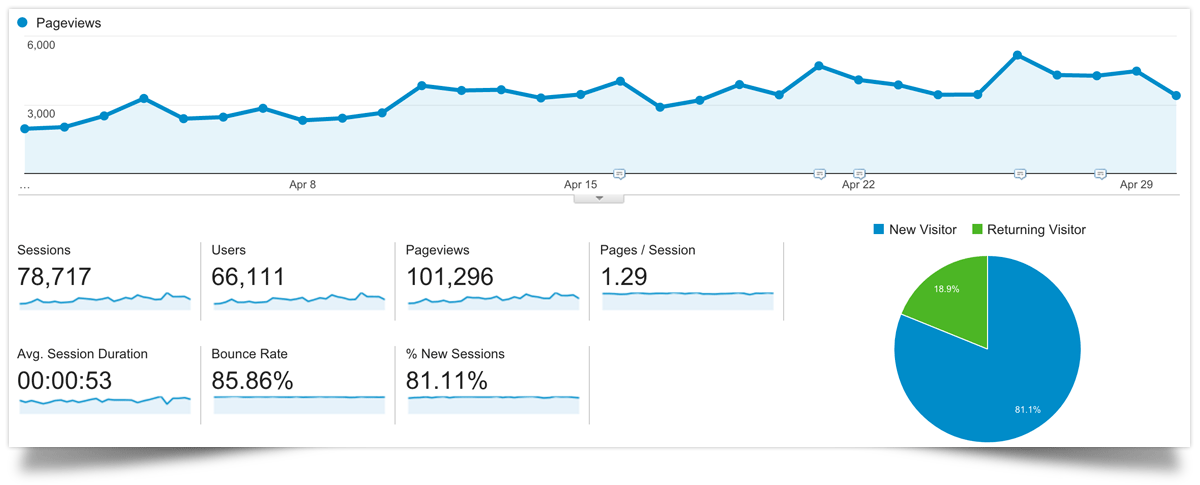
All in all, really solid growth of 64% over March due largely to google search traffic increasing by 61% percent.
The more content you put out on a regular basis combined with the longer you are around equals Google giving your site more authority, ranking you higher and in turn creating traffic. For us, April was when it felt like google finally noticed us and traffic started to come in from search.
April breakdown
Income: $347.84
Expense: $256.36
Bluehost Hosting: $8.20
Adobe Creative Cloud: $10.94
Capture One: $10.00
Tailwind: $11.00
Buffer: $10.00
VaultPress: $5.00
Net Profit: $91.48

Traffic
Focus on what you love
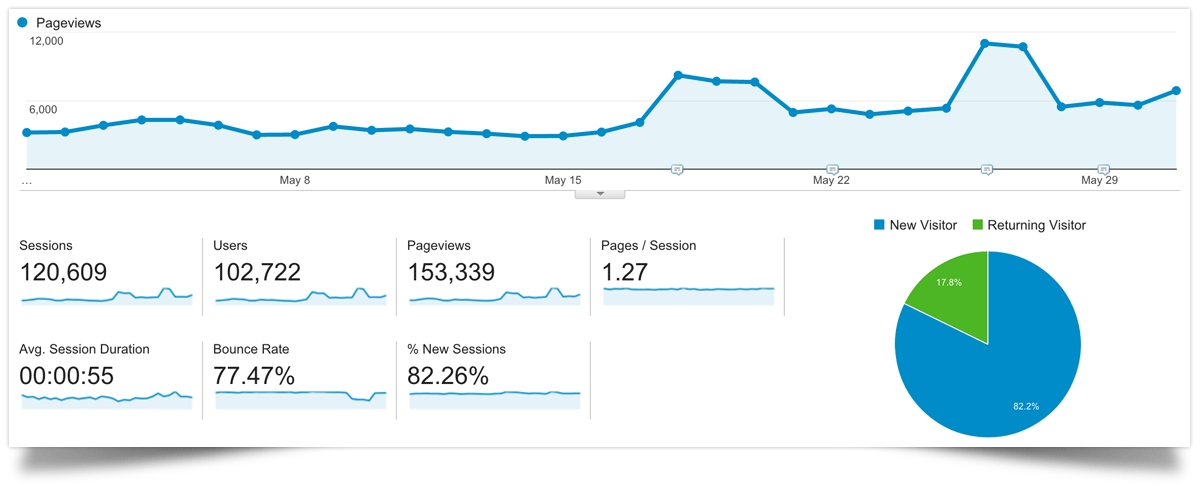
We had a big traffic spike in May because we focused on what we love.
In our home town of Cedar Rapids, IA there is a restaurant called The Irish Democrat that makes what they call Cheese Wontons. Fried wonton wrappers filled with Monterey jack cheese that you dip in a honey mustard sauce.
We love them.
When I was a kid, I’d get one order as an appetizer and one for my entree.
The love hasn’t faded.
So, we went about recreating them and posted them on the blog. No research was done as to whether they’d perform well with SEO (Search Engine Optimization) or if they were something people wanted. We just knew we loved them and wanted to share them with our readers.
That post went live in November 2014 and in May 2015 they were featured by BuzzFeed. About a week later, they were then featured on the BuzzFeed Food Facebook page giving us two big traffic bumps in May.
Moral of the story
You never know what is going to strike a chord or be featured when you’re writing posts. Stick to what you love and it will resonate with others.
May breakdown
Income: $610.16
Expense: $146.65
Bluehost Hosting: $8.20
Adobe Creative Cloud: $10.94
Capture One: $10.00
Tailwind: $11.00
Buffer: $10.00
OptinMonster: $16.60
VaultPress: $5.00
Net Profit: $463.51

Traffic
Lights, camera, action
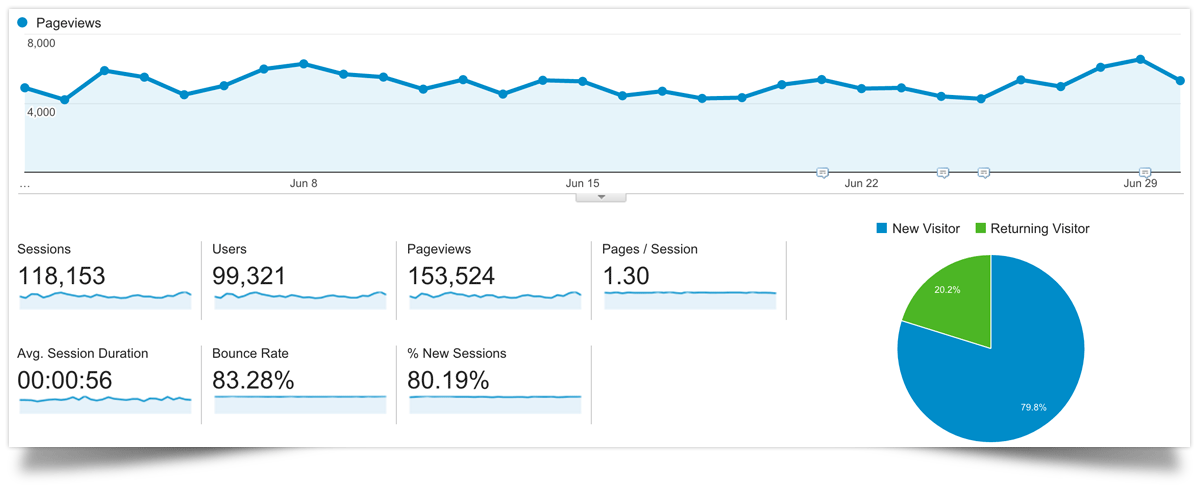
In June we did our first video test (You can watch it here) that we planned on testing for a couple months while we got everything figured out. Well, it turned out so well that we ended up using it as the first video on the site.
YouTube is definitely going to take time to grow, but as you can see with the blog up to this point, wherever you’re trying to make a footprint, it’s important to start as soon as possible creating great content and the traffic will follow.
Hanging in there
There was no real traffic growth from May to June, but a large part of May’s traffic was from two large bumps in traffic. The exciting thing for us was that after those bumps, traffic remained strong and steady without any big features. So, by just slightly increasing from the previous month we felt that was a huge win!
June breakdown
Income: $919.73
Expense: $230.14
Bluehost Hosting: $8.20
Adobe Creative Cloud: $54.79
Capture One: $10.00
Tailwind: $11.00
Buffer: $10.00
OptinMonster: $16.60
VaultPress: $5.00
Mailchimp: $18.00
AudioJungle (video music): $60
Net Profit: $689.59

Traffic
Full timing it
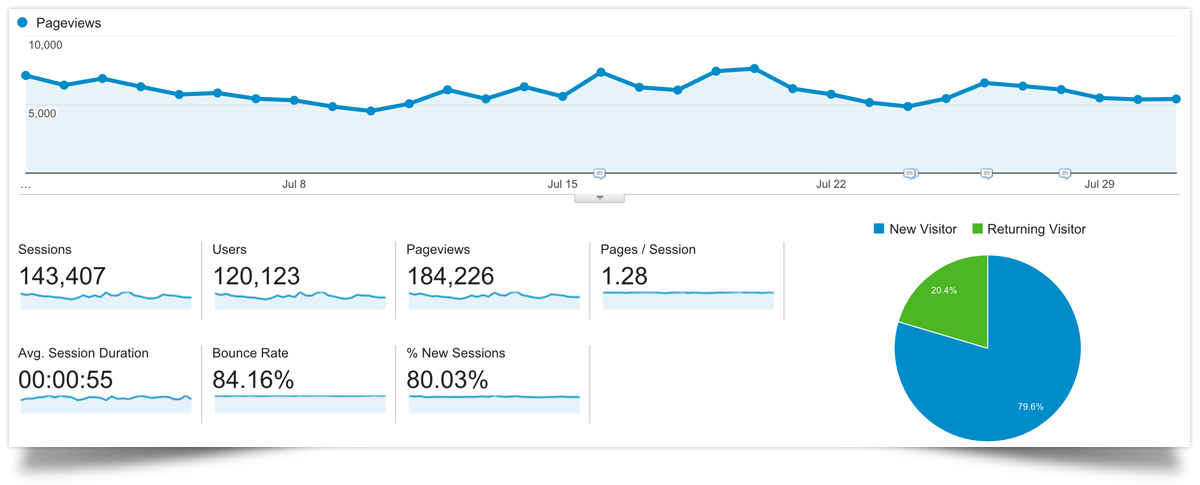
July was my first month working on the blog full-time with Jennifer. Even as I type that, I can’t believe we made the jump. With our goals (which you can read about in the About Us) it was the right thing to do, even though it meant giving up a great job and using our savings to take a risk! My last day was in the middle of June and I jumped right in to help focus on monetization and workflow efficiencies.
Being nine months in and with the blog growing as quickly as it has, there were an ever increasing number of things to do with each post. This meant developing some applications and documents to get the blog machine firing on all cylinders.
We also moved to a new hosting provider, Synthesis Hosting, which was a lot more expensive but with our growth we wanted to have room to grow with the blog and have confidence the site would be able to handle it when we get traffic surges.
July breakdown
Income: $856.99
Gourmet Ads: $179.50
Sponsored Content: $100.00
Swoop: $7.12
Sovrn: $153.13
Amazon Affiliates: $19.06
YouTube: $2.36
Expense: $226.22
Adobe Creative Cloud: $54.79
Capture One: $10.00
Tailwind: $11.00
Buffer: $10.00
OptinMonster: $16.60
VaultPress: $5.00
Mailchimp: $31.50
Net Profit: $630.77

Traffic
Hey! let’s move!
The last week in July I mentioned off-the-cuff to Jennifer, “why don’t we move somewhere new?”. Three weeks later we had packed everything in a truck and were headed for our new home of Madison, Wisconsin. We didn’t know where we were going to live, except for a luxurious few days spent in a Super 8.
We found our new home the day after we arrived, applied and moved in the next day.
Absolutely crazy!
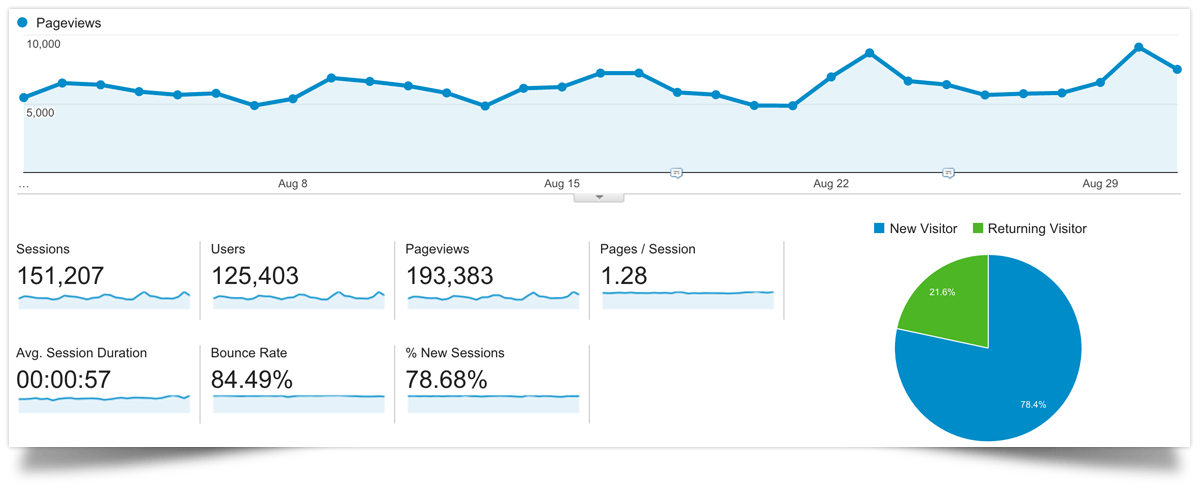
Somehow during the whole process Jennifer didn’t miss a blog post and we had videos shot to cover the whole ordeal. August was a really exhausting month!
Don’t try to do everything yourself
Now that I was on full-time, Jennifer and I really looked at what we could do to maximize revenues. We decided to turn over the ad management aspect of our business to a great company that specializes in just that. The company is AdThrive and we had a really great experience with them on boarding us into the program. We have quite a few custom things going on with the site that they were very patient with working with us on.
As you can see from revenues this month eclipsing $1000 for the first time, they are really good at what they do!
August breakdown
Income: $1,272.52
Google AdSense: $392.45
Sponsored Content: $200.00
Gourmet Ads: $114.04
Swoop: $0
Sovrn: $109.28
Amazon Affiliates: $9.37
YouTube: $5.78
Expense: $239.72
Adobe Creative Cloud: $54.79
Capture One: $10.00
Tailwind: $11.00
Buffer: $10.00
OptinMonster: $16.60
VaultPress: $5.00
Mailchimp: $45.00
Net Profit: $1,032.80

Traffic
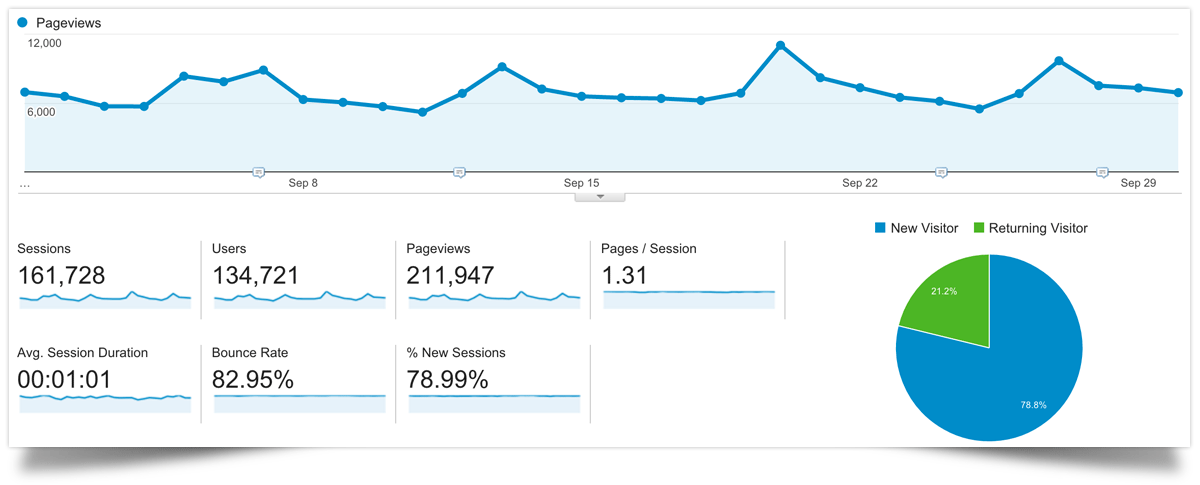
Seo, seo, seo
It was a learning process over the first year how to best optimize each post for SEO so that we could maximize traffic from google. Google is our #1 traffic driver, so it’s a really important element of what we do. You can see from the graph above how much google impacts traffic at this point. Those peaks are mostly Sundays when people are planning their meals for the week.
The other important aspect to keep in mind with SEO and google is that you can pretty much count on compounding growth, the more content you have the more search traffic that will continue to come your way. You can see in the graph below that the increase in search traffic is almost a perfectly straight growth line… which is a really good thing 🙂
1st year google organic search traffic

September breakdown
Income: $2,428.93
Google AdSense: $692.63
Sponsored Content: $500.00
Gourmet Ads: $53.64
Swoop: $0
Sovrn: $1.90
Amazon Affiliates: $4.64
YouTube: $12.40
Expense: $554.72
Synthesis Hosting: $87.33
Adobe Creative Cloud: $54.79
Capture One: $10.00
Tailwind: $11.00
Buffer: $10.00
OptinMonster: $16.60
VaultPress: $5.00
Mailchimp: $45.00
Net Profit: $1,874.21

Traffic
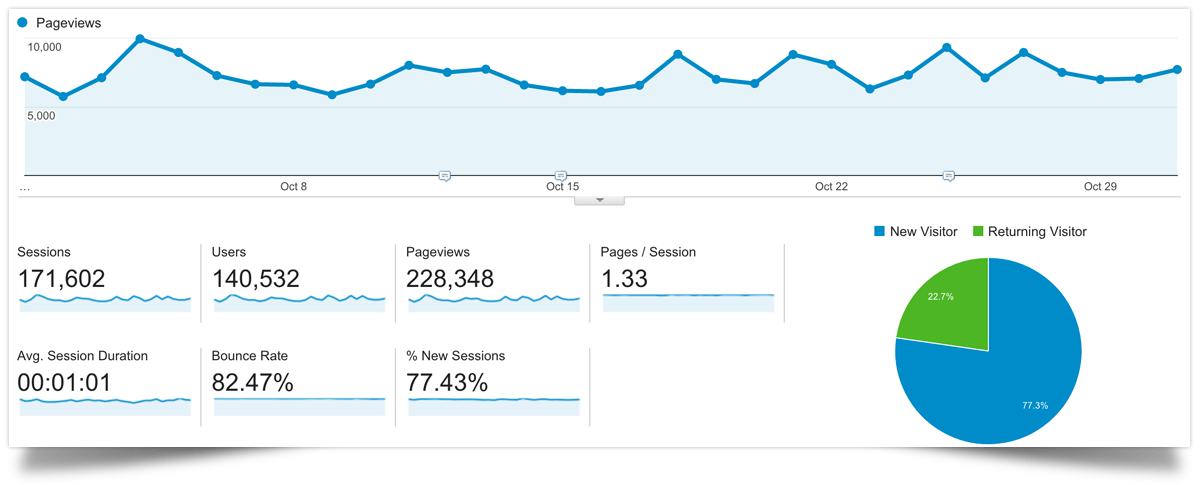
Looking back
We’re pretty blown away when we look back just one year. We were jumping for joy when we made $28 our first full month and a year later this month we made nearly 100 times that, $2738. When the blog started we had on average 33 people come to the blog in an entire day, now we have 33 people on the site in any given minute.
It’s a testament that hard work and patience can really pay off. I have to give most of the credit to Jennifer, this is her baby and I’ve just tried to support and assist in every way that I can. She’s awesome, but you guys already know that.
If you have somehow made it all the way through this novel of a blog post, you’re a rockstar! We hope that if you’ve ever thought about whether it was possible or how to make money with a blog that this has shed some light and reality on what the process looks like and perhaps convinced you to give it a shot.
We have some really exciting things planned for our second year which we’ll start to detail in next months income report. In the meantime, you can sign up for our blogging tips and news just above. We hope you come along for the ride because as we said in the beginning, we couldn’t do this without you!
As always, let us know any questions you have, we want to help in any way we can!
We want to thank everyone that has visited the site and especially those of you who come back to the site regularly looking for recipes. We appreciate your support, your emails and your comments… without you, this wouldn’t be a reality.
October breakdown
Income: $2,738.28
Google AdSense: $832.98
Sponsored Content: $500.00
Gourmet Ads: $62.10
Swoop: $14.61
Sovrn: $0
Amazon Affiliates: $77.77
YouTube: $12.73
Expense: $239.72
Adobe Creative Cloud: $54.79
Capture One: $10.00
Tailwind: $11.00
Buffer: $10.00
OptinMonster: $16.60
VaultPress: $5.00
ActiveCampaign: $45.00


Bill
Jennifer @ Show Me the Yummy
Aaron
Jennifer @ Show Me the Yummy
Elaine
Trevor @ Show Me the Yummy
Zoe
Trevor @ Show Me the Yummy
Amy
Trevor @ Show Me the Yummy
Jamie
Jennifer @ Show Me the Yummy
Sharon
Trevor @ Show Me the Yummy
Kate
Trevor @ Show Me the Yummy
Kate
Adina
Trevor @ Show Me the Yummy
Angel
Jennifer @ Show Me the Yummy
Trevor @ Show Me the Yummy
David
Jennifer @ Show Me the Yummy
Darien
Jennifer @ Show Me the Yummy
Carolina
Jennifer @ Show Me the Yummy
Pooja
Jennifer @ Show Me the Yummy
Whitney
Jennifer @ Show Me the Yummy
brita
Jennifer @ Show Me the Yummy